
From Blog Series From Financial Statements to Operating Decisions
A restaurant’s income statement usually presents labor as a number.
Wages. Payroll taxes. Benefits. Maybe management salaries. Depending on the reporting structure, those costs may be separated between departments or combined into a single labor line.
That is useful for financial reporting.
But it is not enough for operating a restaurant.
Just as cost of goods sold is the financial result of an underlying operating system, labor cost is the financial result of decisions happening throughout the business:
- How much demand was expected?
- How many people were scheduled?
- When were those hours scheduled?
- Which positions were staffed?
- What was the mix of wage rates?
- How effectively did the team handle the workload?
- Did the restaurant have enough capacity when guests actually arrived?
- Did the staffing model support—or undermine—the guest experience?
The financial statement tells us what labor cost.
The operating system needs to tell us why.
And that requires looking beyond labor percentage.
Labor Is Like COGS—but It Is Also Fundamentally Different
In the previous article in this series, we looked at COGS as an operating system.
Food cost does not begin with a percentage on the P&L. It begins with recipes, purchasing, receiving, yields, waste, portions, pricing, product mix, and inventory controls.
Labor works the same way in one important sense:
The financial result is downstream from the operating system.
But there is an important difference.
Inventory can sit on a shelf.
Labor capacity cannot.
A labor hour scheduled from 6:00 to 7:00 tonight disappears when 7:00 arrives whether the restaurant needed the capacity or not.
And if the restaurant schedules too little capacity during a period of strong demand, the cost may not show up as excessive labor at all.
It may show up as:
- longer ticket times,
- fewer tables turned,
- guests waiting longer than expected,
- reduced beverage or dessert attachment,
- employee burnout,
- overtime later in the week,
- mistakes and comps,
- lost repeat visits,
- or revenue the restaurant never had the capacity to capture.
That makes labor management fundamentally different from simply minimizing an expense.
The objective is not the fewest possible labor hours.
The objective is to deploy the right capacity, in the right roles, at the right times, for the demand the restaurant is trying to serve.
Why Labor Percentage Is a Weak Operating Metric
Labor percentage is usually calculated as:
Labor Cost ÷ Revenue = Labor %
There is nothing wrong with that calculation.
Labor percentage is useful for financial analysis, budgeting, benchmarking, and understanding the overall economics of the restaurant.
The problem begins when we treat it as though it tells managers how well labor was operated.
Consider a simple example.
A restaurant uses 160 labor hours at an average wage of $20 per hour.
Labor cost is therefore:
160 hours × $20 = $3,200
If the restaurant generates $12,000 in revenue:
$3,200 ÷ $12,000 = 26.7% labor
If the exact same team works the exact same number of hours at the exact same wage rates, but revenue increases to $14,000:
$3,200 ÷ $14,000 = 22.9% labor
Labor percentage improved by almost four percentage points.
But did the restaurant actually operate labor better?
Not necessarily.
The schedule did not change.
The hours did not change.
The wage rates did not change.
The apparent improvement came from the denominator.
Perhaps more guests arrived. Perhaps menu prices increased. Perhaps beverage attachment improved. Perhaps a private event occurred.
Those are meaningful operating developments—but they are not the same thing as improved labor productivity.
This is why we have argued previously that labor percentage should not be the primary operating metric used to manage a restaurant team.
It combines too many different things into one number.
Start With the Actual Drivers of Labor Cost
At its simplest:
Labor Cost = Labor Hours × Average Cost per Labor Hour
That already gives management a much more useful framework.
If labor cost increases, we can ask:
- Did we use more hours?
- Did our average cost per hour increase?
- Did both happen?
Then go one level deeper.
Instead of treating the restaurant as one labor pool:
FOH Labor = FOH Hours × Average FOH Wage
BOH Labor = BOH Hours × Average BOH Wage
Management Labor = Management Hours or Salaried Cost
Other material labor categories can be separated as needed.
Now management can distinguish between very different situations.
A labor-cost increase caused by an additional 80 production hours is not the same operational problem as a labor-cost increase caused by rising wage rates.
Neither is the same as overtime.
Neither is the same as a change in the mix of managers, servers, bartenders, cooks, hosts, dishwashers, or support staff working a particular period.
The P&L may compress all of those realities into one line.
Good operating information decomposes the line back into the decisions that created it.
The Next Question Is Productivity
Knowing how many hours were used is still not enough.
We also need to know what those hours accomplished.
For restaurants, one of the most useful starting metrics is:
Covers per Labor Hour
Covers ÷ Labor Hours = Covers per Labor Hour
This begins connecting staffing to the actual workload the restaurant served.
Suppose one week produces 2,000 covers using 500 labor hours:
2,000 ÷ 500 = 4.0 covers per labor hour
The next week produces 2,200 covers using 525 hours:
2,200 ÷ 525 = 4.19 covers per labor hour
Labor hours increased.
Labor dollars may have increased.
But the restaurant also handled more demand relative to the capacity deployed.
That is an operating insight that labor percentage alone may obscure.
Why We Prefer Covers per Labor Hour to Sales per Labor Hour
Sales per labor hour is another common restaurant metric.
It is useful—but it is not as fundamental as it initially appears.
That is because:
Sales per Labor Hour = Covers per Labor Hour × Average Spend per Cover
That relationship matters.
Sales per labor hour combines two separate operating systems:
- How productively labor capacity handled guest volume
- How much revenue was generated from each guest
Consider two restaurants serving exactly the same number of guests with exactly the same labor hours.
One sells more wine, appetizers, premium entrées, or desserts.
Its sales per labor hour will be higher.
That may be excellent performance.
But it does not mean its labor system was more productive.
Its average spend per cover was higher.
Separating those drivers makes the information more useful.
Management can then ask:
Do we have a labor-capacity issue, a guest-demand issue, an average-spend issue—or some combination of the three?
That is far more actionable than simply telling a manager that labor needs to be 25%.
The Schedule Is Really a Capacity Plan
A restaurant schedule should not begin with:
“How many labor dollars can we afford?”
It should begin with:
“What demand are we expecting, and what capacity will we need to serve it well?”
The sequence should look more like this:
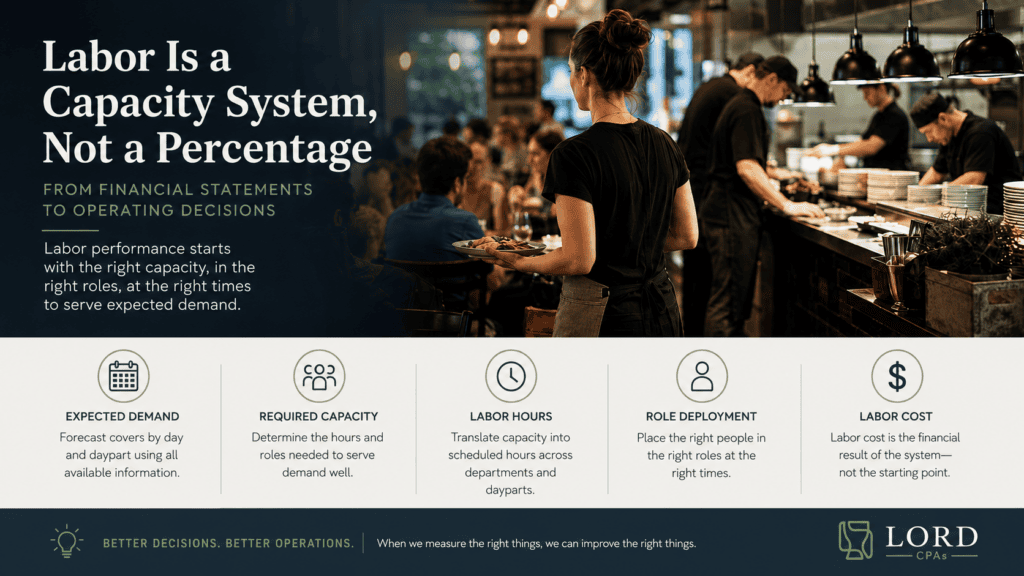
Expected Demand → Required Capacity → Labor Hours → Role Deployment → Labor Cost
For example, if management expects 500 covers and believes the operation can sustainably handle four covers per labor hour:
500 forecasted covers ÷ 4.0 CPLH = 125 labor hours
Those hours still need to be translated into the actual operation.
How many belong in the kitchen?
How many in the dining room?
When does prep need to happen?
When does the bar become constrained?
Where do hosts, food runners, dish, expo, and other support positions become necessary?
When can labor safely flex down?
The productivity target is therefore not the schedule.
It is an input into building the schedule.
A Productivity Standard Should Describe a Healthy System—Not Maximum Human Output
This is where labor management can become destructive if the numbers are used poorly.
If four covers per labor hour is good, why not five?
And if five is achievable, why not six?
Because people are not machines, and restaurant capacity is not infinitely compressible.
At some point, higher measured productivity stops representing a better system and starts representing understaffing.
The symptoms may appear somewhere else:
- slower service,
- declining cleanliness,
- lower attachment rates,
- employee exhaustion,
- weaker hospitality,
- more mistakes,
- increased turnover,
- managers constantly jumping onto stations,
- deferred prep or side work.
A productivity metric should therefore never be interpreted in isolation.
We want to know whether the restaurant is becoming more capable—not simply whether employees are being asked to absorb more work.
This distinction is central to responsible financial management.
The purpose of measurement is discernment, not pressure.
A good labor system should protect both economic sustainability and the human beings doing the work.
Look at FOH and BOH Separately
Whole-restaurant labor metrics can hide important differences.
Suppose total covers per labor hour improves.
That sounds positive.
But perhaps BOH productivity improved significantly while FOH staffing became strained.
Or perhaps the restaurant reduced support positions and appears more productive while servers now spend more time running food, bussing tables, and performing tasks that reduce their ability to sell and provide hospitality.
That is why we generally want to understand labor by meaningful operating function.
At minimum:
Front of House
Look at hours, wage cost, covers per labor hour, deployment by daypart, and whether staffing supported guest experience and sales behavior.
Back of House
Look at hours, wage cost, production requirements, covers or meals produced, prep requirements, menu complexity, and throughput.
Management
Keep management labor visible rather than allowing it to disappear into the operating departments.
A restaurant can appear to improve hourly labor productivity because salaried managers are filling hourly positions.
The labor did not disappear.
It moved.
Good reporting should make that visible.
Financial Reporting Matters, Too
There is another complication: the labor expense shown on the financial statement may not always correspond cleanly to the work performed during that reporting period.
This happens especially when accounting systems record payroll primarily by pay date.
A payroll payment may include labor performed partly in one period and partly in another.
That creates noise.
One month may appear unusually strong because part of its labor has not yet been recorded. The following month appears weak when that cost catches up.
That is a financial reporting issue—not an operating change.
For operational analysis, labor should be aligned as closely as practical with when the work occurred.
Timekeeping records often provide the best starting point:
Actual Hours Worked × Applicable Wage Rates
Salaried management costs can be allocated to the relevant period, with payroll taxes, benefits, bonuses, and other labor burden identified appropriately depending on the analysis.
The goal is not unnecessary accounting complexity.
It is to make sure leaders are responding to economic reality rather than accounting timing.
Build a Weekly Labor Operating Rhythm
The financial statement tells us what happened after the period closes.
A labor operating system needs a much shorter feedback loop.
A useful weekly rhythm might look like this:
1. Forecast Demand
Estimate covers by day and daypart using reservations, historical patterns, seasonality, events, weather, promotions, and other known demand drivers.
2. Translate Demand Into Capacity
Determine the hours and roles reasonably required to serve that demand.
Do this separately for meaningful operating functions rather than treating labor as one pool.
3. Schedule the Capacity
Build the schedule around where workload will occur—not simply around a weekly labor-percentage target.
4. Compare Forecast With Reality
After service, compare:
Forecast covers vs. actual covers
Scheduled hours vs. actual hours
Expected productivity vs. actual productivity
5. Diagnose the Variance
Ask why the numbers differed.
Was the demand forecast wrong?
Did the team stay later than expected?
Was prep inefficient?
Did call-offs cause overtime?
Did an unexpectedly strong service overwhelm one station?
Was there too much labor during a slow daypart?
Did a menu or process change affect throughput?
6. Adjust the System
Use what happened this week to improve the next forecast, staffing model, deployment plan, training process, or operational workflow.
That is how financial information becomes management information.
Labor Should Be Managed With Guardrails
If the only objective is to increase covers per labor hour, management will eventually find a very simple way to accomplish it:
Schedule fewer people.
That is why labor productivity needs operating guardrails.
Depending on the restaurant, those may include:
- ticket times,
- table-turn time,
- guest complaints,
- comps and voids,
- reservation conversion,
- overtime,
- employee turnover,
- employee workload,
- beverage or dessert attachment,
- cleanliness standards,
- manager station coverage,
- and other indicators of service health.
The goal is not maximum CPLH.
The goal is the best sustainable relationship between capacity, demand, guest experience, employee well-being, and financial performance.
That requires judgment.
Numbers inform that judgment.
They should not replace it.
The Questions Leadership Should Be Asking
Instead of asking only:
“Why was labor 29%?”
A stronger operating review asks:
How many covers did we expect?
How many actually arrived?
How many labor hours did we schedule?
How many did we actually use?
Where did those hours go?
What was our FOH and BOH productivity?
Did wage rate or staffing mix change?
Did the operation absorb demand effectively?
Did productivity improve because the system became better—or because people simply worked harder?
Did we protect the guest experience?
What did we learn that should change next week’s schedule?
Now labor is no longer merely an expense to explain.
It becomes an operating system leadership can improve.
From Financial Statement to Operating Decision
The income statement matters.
Labor percentage matters.
Prime cost matters.
But none of those numbers tells a restaurant manager what to do tomorrow by itself.
That is the broader theme of this series.
Financial statements summarize the economic result of the business.
Operating metrics explain how the business produced that result.
For labor, that means moving from:
Labor percentage
to:
hours, wage rates, demand, productivity, role deployment, service quality, and capacity.
And underneath all of those measurements is an important principle:
People are not a percentage to minimize. Labor is capacity to steward.
A healthy restaurant needs enough financial discipline to remain viable and enough operational wisdom to understand where efficiency ends and extraction begins.
The best labor system does both.
It gives leaders enough clarity to use resources responsibly while creating an environment in which employees have the capacity to do excellent work and guests have the opportunity to experience genuine hospitality.
That is a much better management objective than simply chasing a percentage.
About Lord CPAs
Lord CPAs helps hospitality and mission-driven businesses turn financial information into clearer operating decisions. Our work spans bookkeeping, controllership, financial reporting, forecasting, and fractional CFO support, with an emphasis on helping leadership understand not only what happened financially, but what the numbers reveal about the underlying business.
SEO Information
SEO Title: Restaurant Labor Is a Capacity System, Not a Percentage | Lord CPAs
Focus Keyphrase: restaurant labor productivity
Slug: restaurant-labor-capacity-system
Meta Description: Restaurant labor is more than a percentage. Learn how covers, labor hours, wage rates, staffing, and service capacity create better operating decisions.
Featured Image Alt Text: Restaurant team serving guests during a busy service, illustrating restaurant labor capacity and productivity management.
